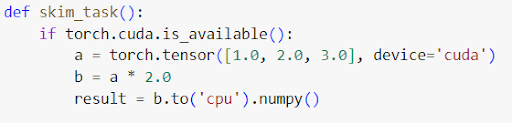
How can I obtain detailed insights for analyzing hardware memory usage in fine detail within a simple Python function as shown below, especially when examining specific lines of code contributing to memory growth, similar to how CPU or GPU profilers work?
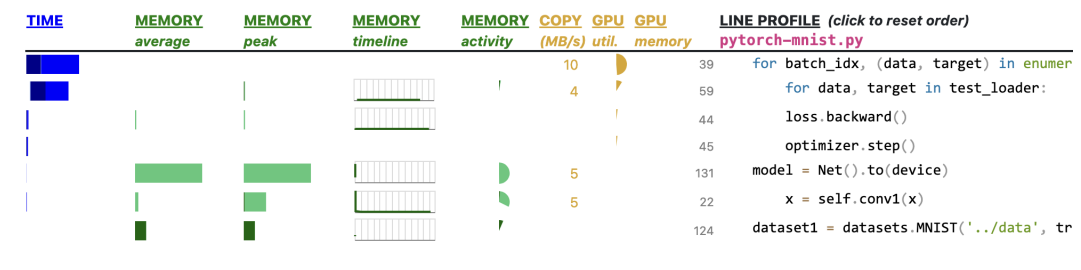
There is this very interesting and amazing work by a team of researchers from UMass called ‘Scalene.’ It precisely and simultaneously profiles CPU, memory, and GPU usage with very low overhead. I am attaching the paper and GitHub link here,
Paper: Triangulating Python Performance Issues with SCALENE | USENIX
Figure from paper: